
Revenue Operations: Running Growth as One System, Not Adjacent Functions
When every function runs the revenue cycle from its own angle, each improvement in marketing or sales becomes cosmetic work on a deeper problem. A framework of two systems, six pillars and nine building blocks, grounded in published field research.
When the revenue cycle is not owned as one system, every improvement in marketing or sales becomes cosmetic work on a deeper problem. The clearest symptom is a growth meeting where each team appears to be describing a different company: marketing presents more signals with less clarity, sales presents intense effort with volatile results, and operations presents rising complexity with hidden costs. Nobody owns a single account of the revenue.
This article sets out a framework for running the revenue cycle as one system, drawing on Revenue Operations by Stephen G. Diorio and Chris K. Hummel, published by Wiley — a work built on over one thousand surveys of and interviews with business professionals conducted during 2020 and 2021.
The Problem Is Not the Teams
The usual description of this condition is that “the teams are not aligned”, and the usual remedy is more coordination meetings. Both are incomplete diagnoses.
The problem is structural, not behavioural. When each team owns its own data, its own metrics and its own definition of success, alignment becomes a personal effort that has to be renewed each quarter and erodes between them. The teams are not failing — they are operating by the logic of the system they were placed in.
The three symptoms recur in almost the same order:
| Function | What it sees | What it conceals |
|---|---|---|
| Marketing | More signals | Less clarity on what converts to revenue |
| Sales | Intense effort | Volatile, hard-to-predict results |
| Operations | Rising complexity | Costs that appear under no line item |
What the three share is that each is correct inside its own island, and wrong at the level of the system.
What Revenue Operations Is
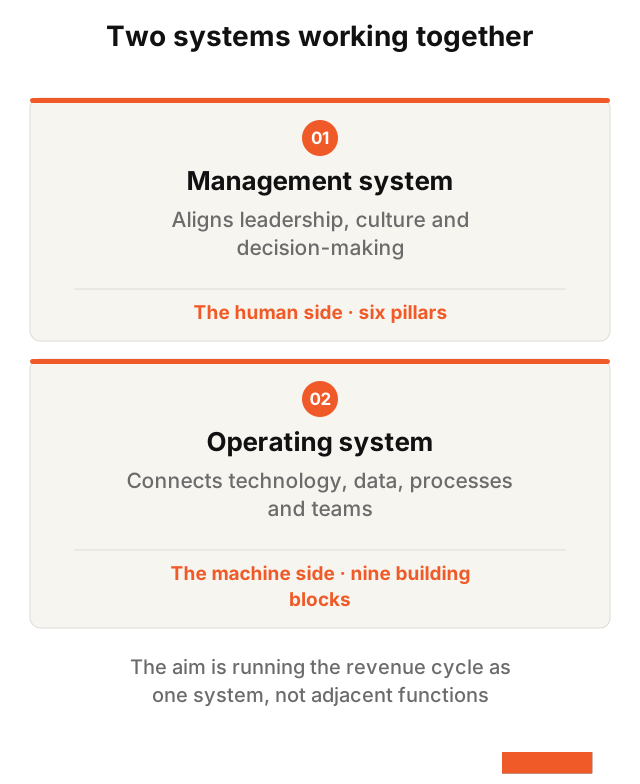
Revenue operations is not a new function bolted onto the org chart, nor a tool to be purchased. It is running the revenue cycle as one system rather than having marketing, sales, service, operations and data work as separate parts.
The system rests on two connected engines, neither of which substitutes for the other:
The management system aligns leadership, culture and decision-making. This is the human side, and it rests on six pillars.
The operating system connects technology, data, processes and commercial assets. This is the machine side, and it rests on nine building blocks.
The most common failure is building one alone: a company buys an integrated technology stack with no governance over it, and gets more abundant data with no better decisions. Or it appoints a revenue leader with no unified data foundation, and gets someone accountable for a number whose sources they cannot see.
The Six Pillars of the Management System
The management system answers one question: how are revenue teams run as a single system? Six pillars carry the answer:
| Pillar | What it addresses |
|---|---|
| Leadership that unifies the teams | Who owns the full revenue cycle, not a portion of it |
| Operations that support growth | A disciplined execution rhythm that turns strategy into decisions and follow-through |
| Structure that maximises return on selling assets | Arranging channels and roles so they do not compete internally |
| Insight built on engagement and activity data | Measuring what actually happens, not what is reported |
| Enablement that turns technology into a force multiplier | Tools that are actually used, not tools that are bought |
| Practices that maximise return on data, technology and content | Treating these assets as capital rather than expense |
The fourth pillar is the most neglected. Most organisations measure outcomes rather than the activities that produce them, so they know they lost without knowing where. Engagement data — who spoke to whom, when, with what content — is what turns a report from a record of what happened into an instrument for changing what happens next.
Who Owns the Decision? Three Models
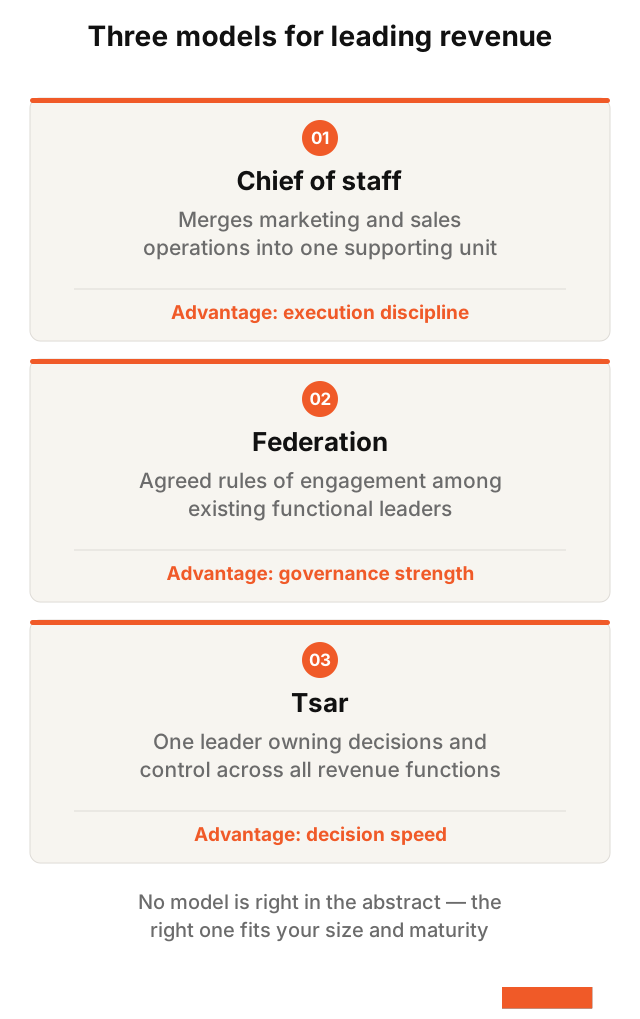
The first practical question in implementation is not “which tools?” but “who owns the decision?” The book presents three common models:
The chief of staff. Marketing operations, sales operations and similar roles are merged into one unit supporting all three functions, led by a single revenue operations executive. The functions stay independent; the operating layer unifies.
The federation. The company establishes agreed rules of engagement among existing functional leaders to manage growth activities. No new central authority, but a governance framework binding on all.
The tsar. Decision-making and operational control across all revenue-related functions are consolidated under one leader.
Which model suits whom
| Model | Grants | Costs |
|---|---|---|
| Chief of staff | Execution discipline and speed in daily operations | Limited authority when priorities conflict |
| Federation | Strong governance without organisational upheaval | Slow resolution when functions disagree |
| Tsar | High decision speed and clear accountability | Organisational resistance and concentration risk |
No model is right in the abstract. The error is not choosing a particular model — it is choosing none, leaving ownership implicitly distributed, which is the condition that produced the problem in the first place.
The Nine Building Blocks of the Operating System
The operating system combines technology, data, processes and teams into one system across the revenue cycle. Nine building blocks fall into three groups:
Group one: the foundation for acquiring customers
| Building block | What it addresses |
|---|---|
| Revenue enablement | CRM, sales enablement and the content technologies that support selling |
| Channel optimisation | Direct, field and partner channels that engage the customer through human interaction |
| Customer-facing technology | The owned digital infrastructure through which the customer interacts with the company |
Group two: turning data into decisions
| Building block | What it addresses |
|---|---|
| Revenue intelligence | How financial value is managed and measured |
| Engagement data hub | Connecting growth assets to value through advanced analytics |
| Customer intelligence | Turning customer data into understanding that guides decisions and conversations |
Group three: execution capacity and return
| Building block | What it addresses |
|---|---|
| Talent development | Attracting, developing and retaining commercial talent |
| Resource optimisation | Directing people and resources to the highest-impact activities |
| Performance management | Defining the right performance metrics, reviewing them and acting on them |
The governing idea is that these blocks do not work as separate tools. An organisation that owns all nine without connection between them does not own an operating system. It owns nine subscriptions.
From Activity to Impact: The Revenue Value Chain
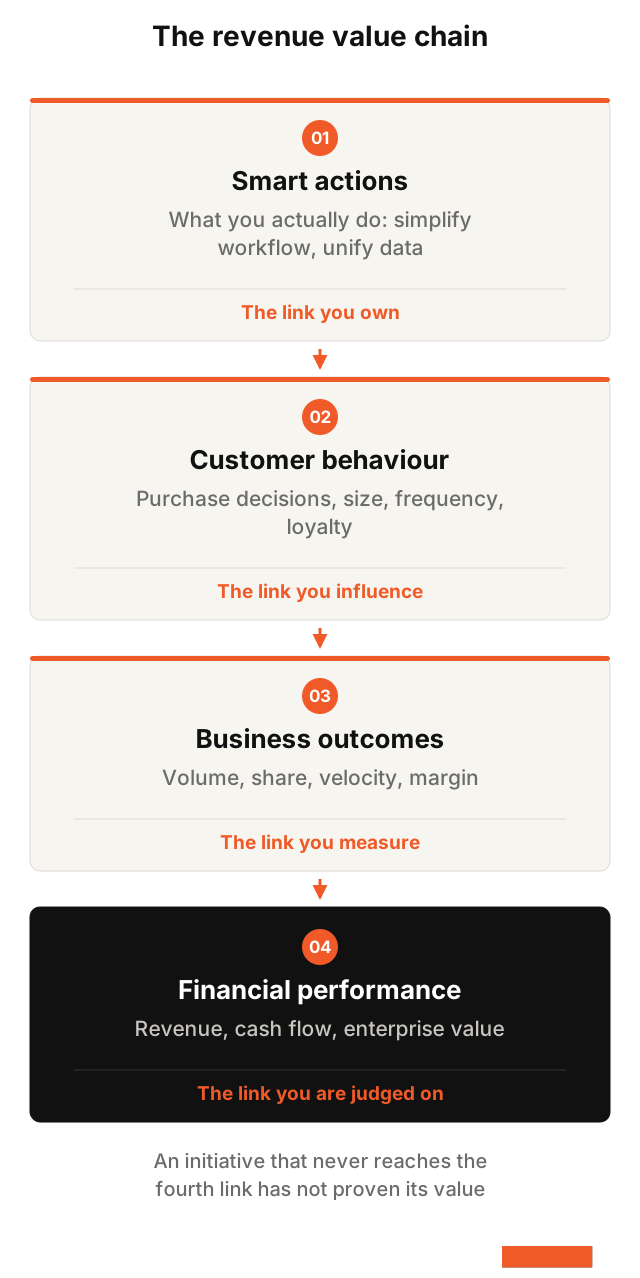
The most important part of the framework — and the least circulated — is its logic of measurement.
The value of growth initiatives is not measured as separate activities, but by their capacity to create effect across a connected chain of four links:
Smart actions. What you actually do: unifying visibility into the revenue cycle, simplifying the selling workflow, shifting marketing insights to frontline sellers, developing and retaining selling talent, making channels more effective, streamlining the content supply chain.
Customer behaviour. What changes as a result: purchase decisions, usage and buying cycles, consumption frequency, purchase size and volume, share of transactions, response and conversion rates, referrals, loyalty, price sensitivity.
Business outcomes. What shows up in operations: volume, share, lift, volatility, velocity, profit margins, customer economics, costs.
Firm financial performance. What reaches the statements: revenue, profits, cash flow, growth rate, asset value, cost of sales, cost of capital, and enterprise value.
The practical benefit of this chain is that it separates what you own from what you are judged on. You own the first link alone, influence the second, measure the third, and are judged on the fourth.
And an initiative whose effect cannot be traced to the fourth link has not yet proven its value — however reasonable it looked in the presentation. That is the criterion separating an operational investment from spending justified by intuition.
Six Actions to Begin
The common error in adopting this framework is waiting to build the perfect system. The book offers six practical actions that start from where you are:
- Visibility. Unify revenue-cycle data into one honest report — one, not one per function.
- Simplification. Remove obstacles from the sales team’s workflow. Every unnecessary administrative step is taken from selling time.
- Sharing. Move marketing insight to the frontline immediately, not in a quarterly report.
- Talent. Identify the skill gaps in your commercial team before adding people to it.
- Channels. Make digital and human channels work in concert rather than competing for the same customer.
- Content. Simplify sellers’ access to the content the customer actually needs.
Note what all six share: each addresses internal friction rather than adding new capability. That is deliberate — in most organisations the fastest return comes from removing what obstructs existing capability, not from buying more of it.
Adapting to Size
The framework is not a rigid model, and its application differs materially by organisational size and maturity.
The large organisation needs governance that manages complexity and unifies work across multiple units and markets. Its risk is rigidity: a tight system that cannot adapt to a moving market.
The smaller organisation needs a lighter system that grants speed and consistency without bureaucracy. Its risk is the opposite: copying enterprise governance until leadership time is consumed managing the system rather than managing growth.
The practical test is simple: if the system consumes more time than it saves, it is larger than your organisation.
What the Numbers Say — and What They Do Not
Figures about the impact of unified revenue operations circulate widely in this field. Two recur most often:
A Gartner projection that 75% of the highest-growth companies will deploy a revenue operations model by 2026, up from under 30% in 2022.
Forrester research indicating that organisations aligning people, process and technology across revenue teams achieve roughly 36% more revenue and up to 28% more profitability.
Here a caveat deserves stating plainly: both figures are widely reported, but the original reports from both firms are not publicly accessible. I have therefore given them attributed as they are reported, not as verified facts I could check at source.
And more important than either figure is what neither says: a correlation between alignment and growth does not establish the direction of causation. Fast-growing companies may adopt these systems because they are growing, rather than the reverse. Or both may follow from a third cause — leadership capable of making decisions.
The stronger argument for this framework is therefore not statistical but logical: a revenue cycle run by adjacent functions with different metrics and separate data necessarily produces conflicting decisions — and that holds whether the effect is 36% or half of it.
Conclusion
Revenue operations is not better coordination between existing teams. It is redesigning the management of growth as one system: clear ownership in leadership, a disciplined operating rhythm, and decisions built on unified information.
The more complex the organisation becomes — more units, more markets, more channels — the higher the cost of that system’s absence, because the individual effort that used to bridge the gap can no longer cover it.
The final difference is that growth stops being the sum of scattered individual efforts and becomes an institutional capability that can be measured and repeated.
Sources
All links below were accessed on 29 September 2026.
Primary reference
Wiley — the publisher’s page for the book.
Diorio, Stephen G., and Chris K. Hummel. Revenue Operations: A New Way to Align Sales & Marketing, Monetize Data, and Ignite Growth. Wiley, 2022. ISBN 9781119871118.
https://www.wiley.com/
Documents: the six core elements of the management system, the nine building blocks of the operating system, and the authors’ backgrounds.
O’Reilly — the licensed text of the book, edition details and Chapter 6.
https://www.oreilly.com/
Documents: that the book is based on over one thousand surveys and interviews with business professionals conducted during 2020 and 2021, that the operating system combines technology, data, processes and teams, and the arrangement of the book’s parts and chapters.
CustomerThink — a detailed review of the book.
https://customerthink.com/
Documents: the three leadership models by name and definition — the tsar, the federation and the chief of staff — the placement of the six pillars in Chapters 3 to 5, and the nine building blocks in Chapters 6 to 10.
Author background
Revenue Enablement Institute, via the publisher and distributor pages.
https://www.amazon.com/
Documents: that Stephen Diorio is Managing Director of the Revenue Enablement Institute and a Senior Fellow at the Wharton Customer Analytics Initiative, and that Chris Hummel is a Managing Director at the same institute.
A note on reported figures
The Gartner and Forrester figures in the section “What the numbers say” circulate widely in this field’s literature, but the original reports from both firms are not publicly accessible. They are given here attributed as reported, not as figures I verified at source — and the distinction between the two is part of the discipline this article argues for.