
B2B Segmentation Is a Leadership Decision, Not a Marketing Exercise
Segmentation is not classifying customers by size and sector. It is the decision about who you serve, with which operating model, and where your resources go. A practical guide with two cases documented from primary sources and a four-layer framework.
Segmentation in B2B is not a marketing exercise for classifying customers by size and sector. It is a leadership decision that determines three things: who you serve and who you leave, which operating model serves each segment, and where your resources go. A business that serves segments with contradictory needs through one model does not win them all — it loses both ends: it over-serves those who do not want the service, and under-serves those who pay the most.
This article sets out a four-layer framework for building segmentation that can carry a decision, with two cases documented from primary sources and a practical test.
The Deal That Looks Like Growth
Some deals do not reveal their nature at the start. They look like a win in the quarterly report, and their real effect surfaces months later — when they consume more of the team’s time than they merit, blur the company’s position in the market, and drain cash through commitments that were never priced.
In B2B, not every profitable deal is growth. Sometimes the risk is winning an opportunity that does not fit your model.
This does not mean refusing opportunities. It means knowing which commercial battle deserves your resources before you enter it — which is precisely what segmentation does when it is built for decisions rather than for slide decks.
Why It Is a Leadership Decision
In most textbooks, segmentation is presented as a marketing tool: divide your market, classify your customers by size, sector and location, target the right segment.
This is not wrong — but it is not sufficient, because it answers only one question: who are these customers? It leaves the more important one unanswered: what do they want from us, and does our model suit them?
The difference is not theoretical. Marketing segmentation produces different messages for different segments. Leadership segmentation produces different operating models — a decision marketing cannot own alone, because it touches pricing, service, channel and cost structure.
Three questions establish whether you are facing a leadership decision or a classification exercise:
- Who do we serve, and who do we deliberately leave?
- Which operating model serves each segment?
- Where do the resources go, and where do they stop?
A business that cannot answer the third has not segmented its market. It has only classified its customers.
The Number That Changes the Timing Calculation
Before the framework, one figure deserves a pause.
In 6sense’s 2025 B2B Buyer Experience Report, based on a survey of nearly four thousand B2B buyers across North America, EMEA and APAC, 94% of buying groups said they had ordered their shortlist by preference before speaking to any seller. The vendor ranked first goes on to win about 80% of the time.
And further: 95% of the time, the winning vendor was already on the shortlist from day one.
The practical implication is that the contest is decided before you know it has begun. The consequence for segmentation is direct: precise targeting is worthless once the buyer has ordered their list. The segmentation that works is the kind that places you on the list before it forms — and that comes not from classifying accounts, but from understanding the need that drives the buyer to start looking at all.
Four Layers of Segmentation
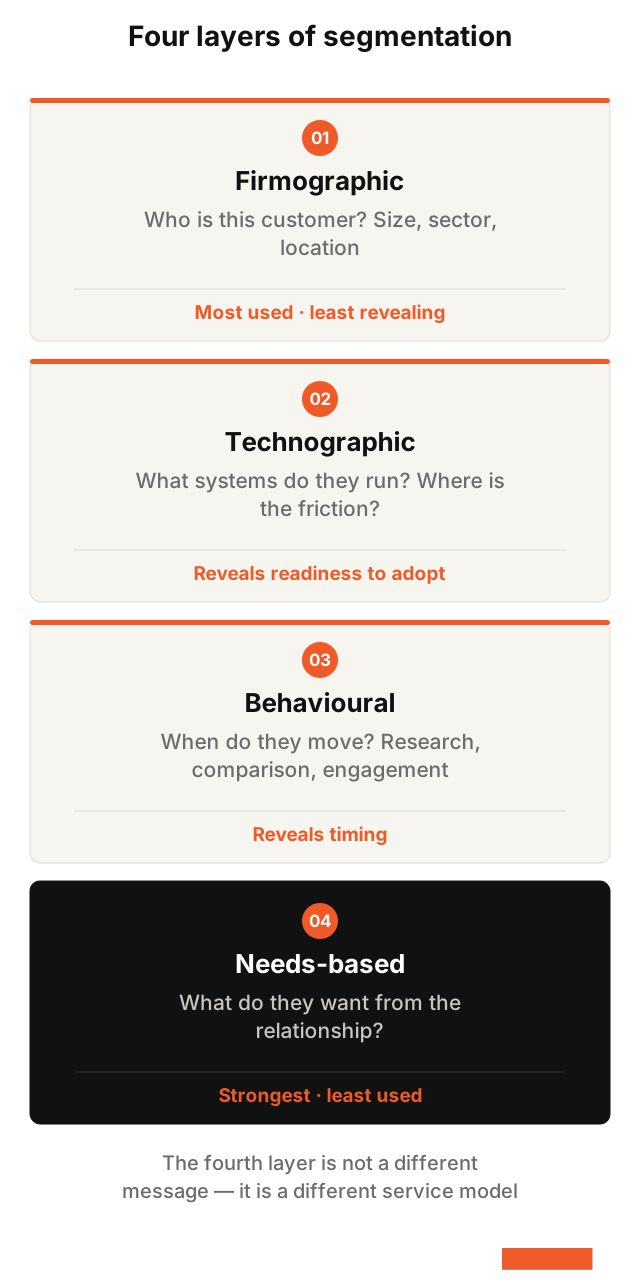
Strong segmentation does not rest on one layer but on four cumulative ones, each answering a different question:
Firmographic. Who is this customer? Size, sector, location, headcount. It is the most used layer and the least revealing, because it describes the company and says nothing about its behaviour.
Technographic. What systems do they run? Who are their current suppliers? Where is the friction in their stack? This layer reveals readiness to adopt and the cost of switching — heavy commercial information that most segmentation ignores.
Behavioural. When do they move? What are they researching? When do they compare, and who do they engage? This layer reveals timing — it is the closest thing to an early signal.
Needs-based. What do they specifically want from a relationship with us? This is the strongest layer and the least used.
Why the Fourth Layer Decides
Two customers in the same sector, of the same size, in the same city, can differ completely in what they are actually buying. One pays for expertise, advice and technical support. The other wants the product alone at the lowest possible price, and regards everything else as a cost paid for nothing.
The first three layers place them in the same box. Only the fourth reveals that they are two segments.
And serving them with the same model loses both: the first because they did not get the depth they pay for, the second because they paid for services they never asked for — and then left for a cheaper competitor.
Needs-based segmentation is not a different marketing message. It is a different service model.
Four Questions That Reveal Need Segments
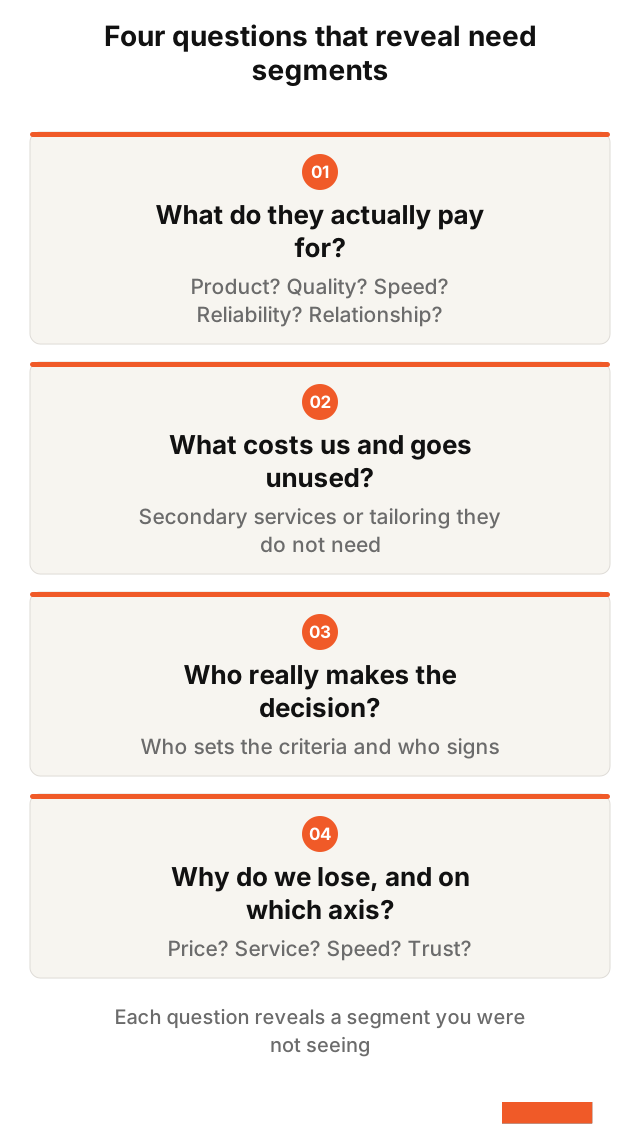
You do not need a market study to begin. You need to ask your team four questions about every customer in your existing base:
| Question | What it reveals |
|---|---|
| What does this customer actually pay for? The product alone? Quality? Speed? Reliability? The personal relationship? | The real axis of value |
| What costs us and goes unused? Secondary services they do not benefit from, or tailoring they do not need | Over-service |
| Who really makes the decision? The finance director? The technical lead? The owner? A buying committee? Who sets the criteria and who signs? | The decision centre |
| Why do we lose to competitors, and on which axis? Price? Service? Speed? Trust? | The limits of your model |
The second question is the most revealing and the least asked, because it measures a cost the business carries against value the customer does not see — the purest picture of a mismatch between model and segment.
Each of the four reveals a segment you were not seeing. Together they produce a map that shows not only where you grow, but where you drain yourself.
Case One: When a Company Discovers It Does Not Know Its Customers
The situation
Dow Corning — the joint venture between Dow Chemical and Corning — was among the world’s largest silicone producers, with roughly seven thousand products and twenty-five thousand customers worldwide.
Its model was clear and coherent: high quality, integrated technical service, and a premium price reflecting both.
Its market segmentation was by industry — construction, electronics, healthcare, automotive. A division that told it where its products were used, but said nothing about why customers bought.
The shock
As the market matured, silicone began commoditising, and competitors entered with standard products at lower prices. In 2001, the company’s revenues fell 11%.
The conventional response in such a case is familiar: cut your prices. But management chose to understand before acting, and ran a full strategic review of its customer base.
What the review found
The discovery overturned the company’s central assumption.
Regardless of industry, the company found its customers fell into four need segments, ranging from the pure innovation seeker to the pure price seeker, with gradations between.
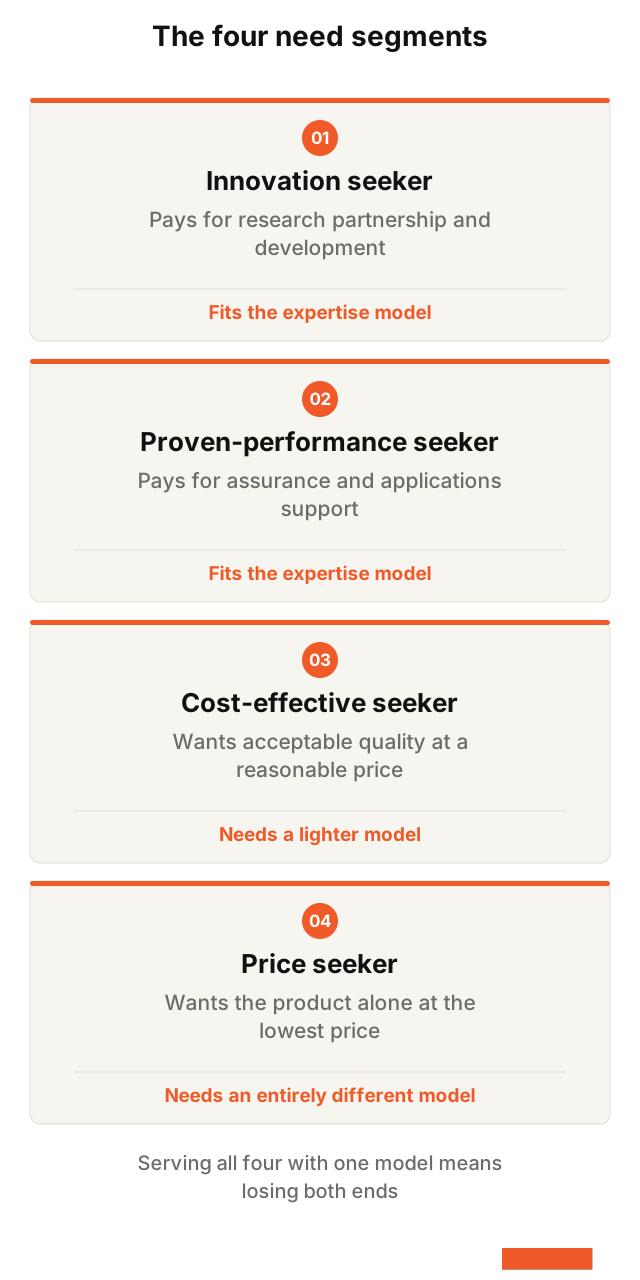
Here the problem surfaced: the company was over-serving the price seekers with an expensive, high-touch model they neither needed nor valued — and then losing them to a cheaper competitor. At the same time, resources spread across everyone denied the two highest-value segments the focus they deserved.
The decision
Here lies the most important lesson in the whole case.
The company did not cut its prices. Its leadership — the chief financial officer of the time among them — recognised that charging less for the same model would produce unacceptably low margins and make the segment unattractive in the long run. The answer was not cutting services alone, but a radically different cost structure allowing a price point below any existing offer.
So in 2002 the company launched a separate brand with a separate operating model, on strict rules:
- Online ordering only
- No sales representatives
- Large minimum order quantities
- No accompanying technical services
- Made to order, with defined lead times
- Market-driven pricing
The parent brand was simultaneously refocused on integrated solutions and services — so that rather than the new brand weakening the original, each reinforced the other through clear differentiation.
The result
In its first year, the new model cut logistics costs by 60%, saving approximately three and a half million dollars — mainly from eliminating warehousing and shipping larger loads. The significant reduction in inventory also freed working capital, as products were now made to order.
The effect showed across the company’s trajectory:
| Year | Revenue growth | Net income |
|---|---|---|
| 2001 | −11% | — |
| 2002 | +7% | $141.6 million |
| 2003 | +10% | $177 million |
The strength was not in serving everyone, but in serving each segment with the model that suited it.
Case Two: Segmentation Inside a Service Portfolio
The previous case shows what happens when a new segment gets a new model. The next shows the other side: what happens when needs move between existing segments.
The structure
Aramex, the UAE logistics group founded in 1982 and listed on the Dubai Financial Market, operates in more than six hundred cities across seventy countries with over sixteen thousand employees.
It is organised around four product lines rather than geographic divisions: international express, domestic express, freight forwarding, and contract logistics.
This is not an administrative classification. Each line serves a different need through a different operating model: the large enterprise wanting contractual solutions and high compliance is nothing like the e-commerce merchant wanting automation and efficiency, or the individual wanting reasonable price and speed.
What 2024 revealed
In financial year 2024, group revenue grew 11% to AED 6.32 billion, and net profit 10% to AED 142 million.
But the headline figure conceals something more important — real movement between segments:
| Product line | Revenue growth | Gross profit growth |
|---|---|---|
| Domestic express | +18% | +27% |
| Freight forwarding | +15% | −4% |
| International express | +5% | Flat |
| Contract logistics | +6% | +8% |
The significance lies in the quarterly detail: in the fourth quarter of 2024, international express revenue fell 6.2% while domestic express jumped 33%.
The company’s own explanation is that customers began positioning inventory closer to their markets, so shipments shifted from long-haul crossing to local and intra-regional movement. International shipment volumes grew 20% even as fourth-quarter revenue declined — because the nature of the shipment changed, not because demand fell.
The group did not lose the demand. It absorbed it in another line. That is what separate operating models for separate needs make possible.
And what honesty requires
One year does not make a rule, and integrity requires reporting what followed.
In financial year 2025, revenue grew just 1% to AED 6.36 billion, gross profit fell 4%, and operating profit declined 35%.
The lesson is sharper than “segmentation works”: separating operating models gives a business the capacity to absorb a shift in demand between its segments without breaking overall growth. It does not immunise it against margin pressure when competition intensifies within those segments.
Segmentation is a shock absorber for shifts, not a guarantee of growth.
What AI Changes — and What It Does Not
Segmentation has always collided with three practical obstacles:
- Data volume beyond the team’s capacity. Thousands of customers, multiplied by dozens of signals each, multiplied by years of history.
- Hidden signals invisible to the eye. Purchase patterns, timing, gradual behavioural shifts — buried in data nobody reads.
- An analysis cycle slower than the market. What warrants a decision today reaches leadership in the quarterly review.
Artificial intelligence genuinely addresses all three: it reads volumes beyond human capacity, surfaces need patterns that could not be seen manually, and compresses the analysis cycle from months to weeks.
But the result is not new segmentation. It is the same segmentation, deeper, faster and more precise.
And one decision remains that cannot be automated: which customer deserves the investment?
Tools rank, classify and predict inside criteria a human sets. And whoever sets the criteria decides who the business serves and who it refuses — a leadership decision by nature, and automating it means executing your wrong criteria more efficiently.
AI may read the market. Leadership alone chooses the battle.
The Practical Test
Four steps, in this order:
Audit what you have. Gather three years of win-loss data, your current segmentation, and each segment’s performance over thirty-six months. The output: a list of segments where you neither won nor grew.
Define who you actually win. Not “who we target” but “who we win profitably.” The gap between those two lists is the size of the problem.
Map the decision centre. For each account: who sets the criteria, who signs, and where the friction sits in their operation.
Activate a signal system. Early alerts on what precedes need: a leadership change, a funding round, a revealing job posting, an announced initiative.
And the step usually skipped: write the list of who you will not serve now. The strategy says what you do; this says what you refuse — and without the second, the first degrades into intent.
Conclusion
Segmentation built for a slide deck produces elegant segments that change no decision. Segmentation built for decisions produces one sharp question: does our operating model suit this segment, or are we serving it with a model designed for someone else?
Dow Corning did not prevail by cutting prices, but by understanding that some customers needed a different model. Aramex did not protect its growth merely by widening its services, but by separating needs that should not be run the same way.
The question in the end is not: how many segments do we have? It is: how many operating models do we own — and is that enough?
Sources
All links below were accessed on 26 September 2026. Sources are ordered strongest first: filings by listed companies, then published field research, then specialist reporting.
Company filings
Aramex — press release of financial results for the year ended 31 December 2024, filed via the Dubai Financial Market.
https://feeds.dfm.ae/
Documents: revenue of AED 6.324 billion at 11% growth, net profit of AED 141.8 million at 10% growth, the detailed annual and quarterly performance of all four product lines, the volume shift between international and domestic express, and operations across seventy countries with over sixteen thousand employees.
Aramex — press release of financial results for the year ended 31 December 2025.
https://www.aramex.com/
Documents: revenue of AED 6.36 billion at 1% growth, gross profit down 4%, and operating profit down 35%.
Aramex — 2024 financial report within the annual integrated report.
https://www.aramex.com/
Documents: the company’s own financial analysis and performance review.
Published field research
6sense — B2B Buyer Experience Report 2025, a survey of nearly four thousand B2B buyers across North America, EMEA and APAC.
https://6sense.com/
Documents: that 94% of buying groups ordered their shortlist by preference before speaking to any seller, that the first-ranked vendor wins about 80% of the time, that the winner was on the day-one shortlist 95% of the time, and that where the list was not pre-ordered the first vendor spoken to won only 57% of the time.
Specialist reporting
CRM Magazine — “Dow Corning’s Extreme Makeover”.
https://www.destinationcrm.com/
Documents: seven thousand products and twenty-five thousand customers, revenues down 11% in 2001 then up 7% in 2002 and 10% in 2003, and net income of $141.6 million in 2002 and $177 million in 2003.
Reliable Plant — “Two-brand strategy spells success for Dow Corning”.
https://www.reliableplant.com/
Documents: a 60% reduction in logistics costs in the first year saving approximately $3.5 million, working capital freed through made-to-order production, and the parent brand’s simultaneous refocus on solutions and services.
Chief Executive — “How Dow Corning Beat Commoditization By Embracing It”.
https://chiefexecutive.net/
Documents: that the strategic review found four need segments regardless of industry, that cutting price alone would have produced unacceptable margins, and that the answer required a radically different cost structure rather than merely reduced services.
Rubber & Plastics News — “Xiameter business a Web success story”.
https://www.rubbernews.com/
Documents: the separate brand’s 2002 launch with roughly four hundred products, its later expansion, and the parent brand’s reservation for high-value products with customised services.
A note on figures left out
Three figures commonly circulated on this topic were excluded from this article because they could not be traced to a reliable primary source: the new-product failure rate usually quoted without precise attribution, Dow Corning’s market share before 2001, and the share of price seekers in the total market. What cannot be sourced is not stated.